Debugging the Linux Kernel with QEMU and GDB
In the previous article, we explored how to run a raw Linux kernel in QEMU. Another fascinating feature that QEMU provides is to initiate a GDB server. An external GDB debugger can then connect to it. This means that we can suspend the kernel running at any point of the kernel startup. By leveraging this feature, we can construct an efficient environment to debug system kernels and firmware. In this guide, we will explore the process of using this feature to debug the Linux kernel.
Compiling the Kernel with Debugging Information
The first step involves preparing a kernel embedded with debugging information. To achieve this, we enable the relavent kernel configurations:
$ cd linux-source/
$ make menuconfig
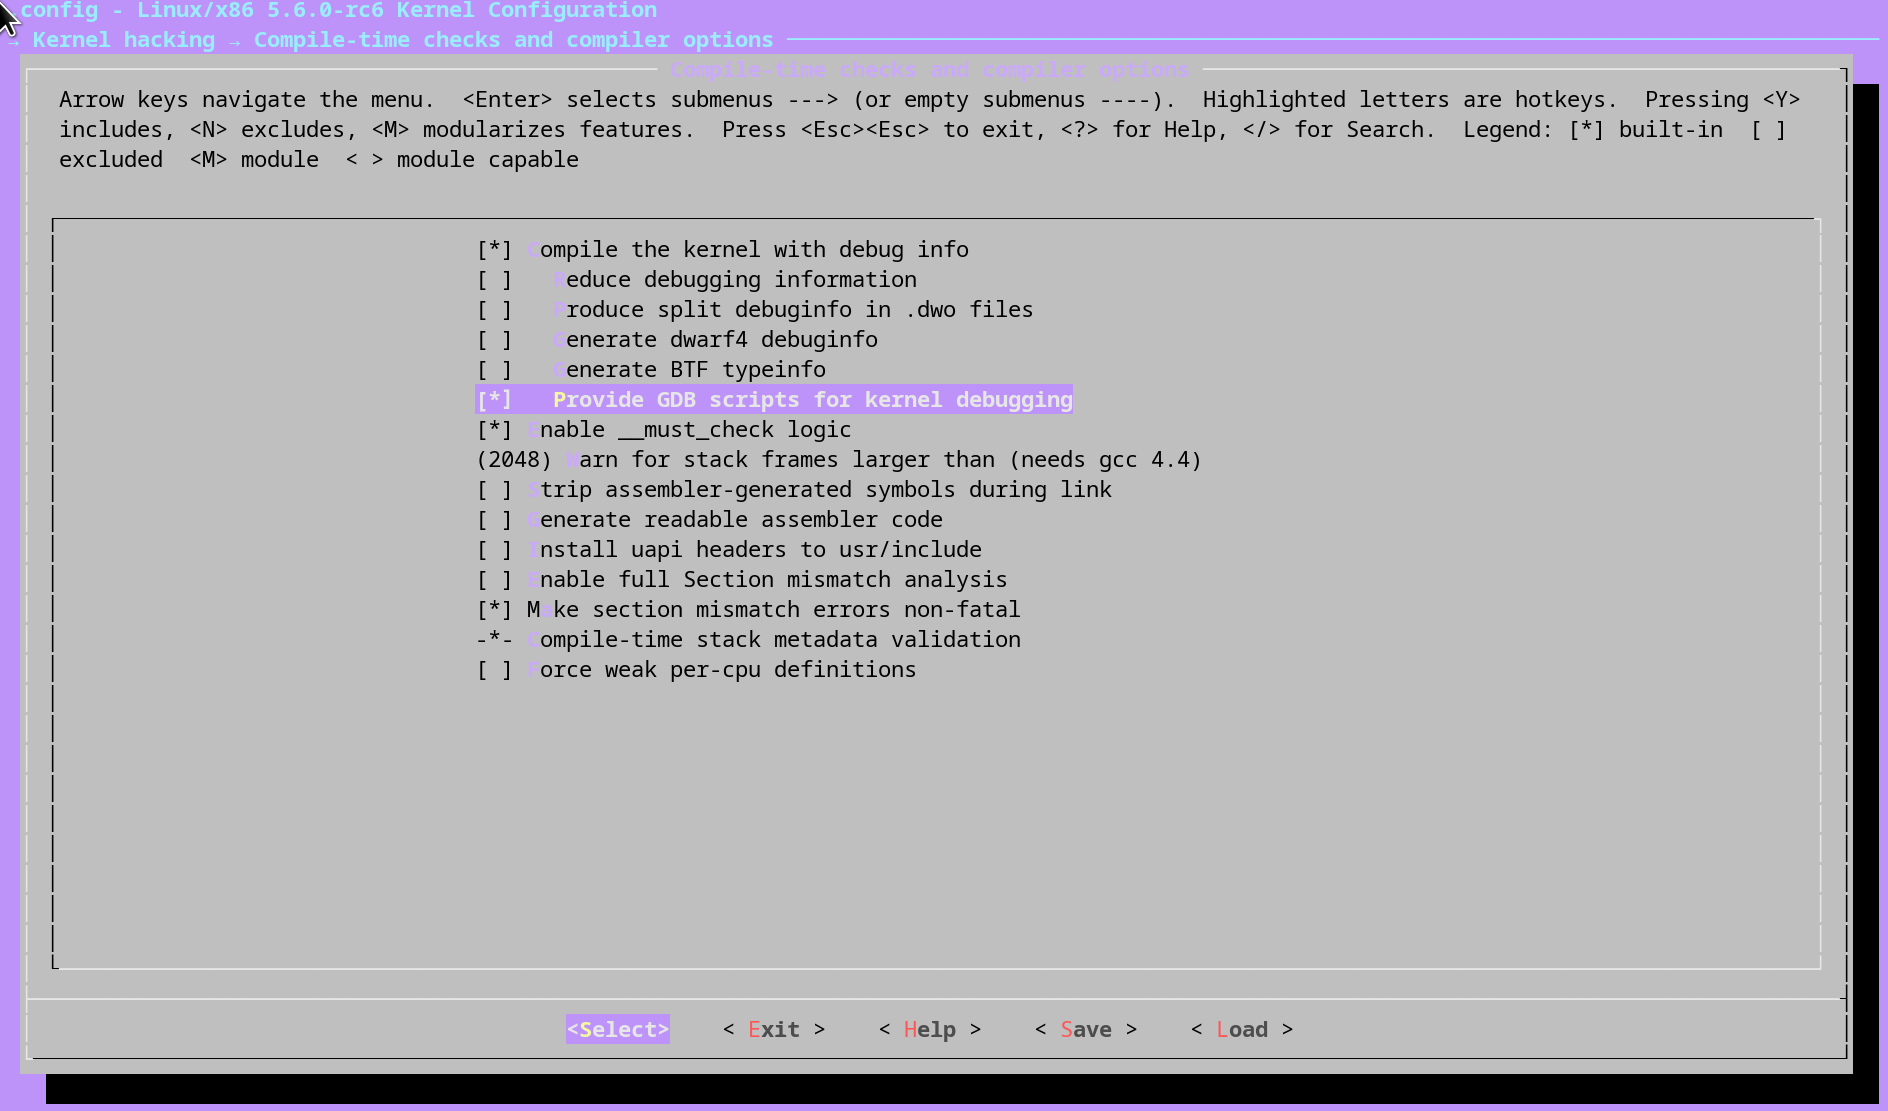
Next, navigate to Kernel hacking > Compile-time checks and compiler options. Here, enable the following two options:
- Compile the kernel with debug info
- Provide GDB scripts for kernel debugging
Once we’ve made these changes, save the new configuration and initiate the kernel compilation by executing make -j${nproc}. Following the compilation, we are interested in the two newly created files:
- vmlinux: A statically linked executable file format of the Linux Kernel, packed with all debugging information.
- scripts/gdb/vmlinux-gdb.py: The GDB script used for kernel debugging.
To ensure that the GDB script loads every time we initiate the GDB Debugger, let’s add it to the GDB init file:
$ echo "add-auto-load-safe-path `pwd`/scripts/gdb/vmlinux-gdb.py" >> ~/.gdbinit
Initiating Debugging Session
When debugging, QEMU provides two significant options:
- The
-Soption stops the CPU at the startup, allowing the debugger to connect and facilitating debugging from the start. - The
-soption initiates a GDB Server on port 1234. Consequently, we can connect the GDB Debugger we can connect to it usingtarget remote :1234.
Now let’s boot the kernel with these options:
$ qemu-system-x86_64 \
    -S \
    -s \
    -enable-kvm \
    -kernel bzImage \
    -smp cores=1,threads=2 \
    -m 1024 \
    -append "console=ttyS0 nokaslr selinux=0 debug" \
    -initrd initramfs.img \
    -serial stdio \
    -display none
At this stage, the process remains on hold, since we instructed QEMU to pause for the debugger by using the -S option.
Open another terminal window and start the GDB Debugger, then connect it to QEMU:
$ gdb vmlinux
Type "apropos word" to search for commands related to "word"...
Reading symbols from vmlinux...
(gdb) target remote :1234
Remote debugging using :1234
0x000000000000fff0 in exception_stacks ()
Now we can set breakpoints and track the kernel’s executing as if it were just a normal user process:
(gdb) b start_kernel
Note: breakpoints 1 and 2 also set at pc 0xffffffff829e0aa8.
Breakpoint 3 at 0xffffffff829e0aa8: file init/main.c, line 786.
(gdb) c
Continuing.

Thread 1 hit Breakpoint 1, start_kernel () at init/main.c:786
786     {
...